Changes for page Chart
Last modified by Travis Tran on 2019/07/22 13:07
edited by Xwiki Admin
on 2018/03/14 16:00
on 2018/03/14 16:00
edited by Travis Tran
on 2019/07/22 13:07
on 2019/07/22 13:07
Change comment: Install extension [org.xwiki.contrib:application-help-center/1.5.1]
Summary
-
Page properties (3 modified, 0 added, 0 removed)
Details
- Page properties
-
- Title
-
... ... @@ -1,1 +1,1 @@ 1 - Chart1 +$services.localization.render('help.macros.chart.title') - Author
-
... ... @@ -1,1 +1,1 @@ 1 -XWiki. XwikiAdmin1 +XWiki.ttran - Content
-
... ... @@ -2,11 +2,14 @@ 2 2 {{toc start="2" /}} 3 3 {{/box}} 4 4 5 -**Chart Macro** displays graphical charts generated from miscellaneous data sources. [[Learn more>>http://extensions.xwiki.org/xwiki/bin/view/Extension/Chart+Macro]] 5 +{{velocity}} 6 +$services.localization.render('help.macros.chart', ['**', '**']) [[$services.localization.render('help.more.label')>>http://extensions.xwiki.org/xwiki/bin/view/Extension/Chart+Macro]] 6 6 7 -== PieChart ==8 +== $services.localization.render('help.macros.chart.pie') == 8 8 9 -=== Example 1 === 10 +=== $services.localization.render('help.macros.example') 1 === 11 +{{/velocity}} 12 + 10 10 {{example}} 11 11 {{chart type="pie" source="inline" params="range:B2-D5;series:columns;" title="Pie Chart" width="320" height="240"}} 12 12 |=|=X|=Y|=Z ... ... @@ -17,7 +17,10 @@ 17 17 {{/chart}} 18 18 {{/example}} 19 19 20 -=== Example 2 === 23 +{{velocity}} 24 +=== $services.localization.render('help.macros.example') 2 === 25 +{{/velocity}} 26 + 21 21 {{example}} 22 22 {{chart type="pie" source="inline" params="range:B2-D5;series:columns;colors:d9534f,f0ad4e,337ab7,5cb85c;backgroundColor:FFFFFF;" title="Pie Chart"}} 23 23 |=|=X|=Y|=Z ... ... @@ -28,7 +28,9 @@ 28 28 {{/chart}} 29 29 {{/example}} 30 30 31 -== Bar Chart == 37 +{{velocity}} 38 +== $services.localization.render('help.macros.chart.bar') == 39 +{{/velocity}} 32 32 33 33 {{example}} 34 34 {{chart type="bar" source="inline" params="range:B2-D5;series:columns;colors:C3E3F7,1D9FF5,015891,012A45;backgroundColor:FFFFFF;" title="Bar Chart"}} ... ... @@ -41,7 +41,9 @@ 41 41 42 42 {{/example}} 43 43 44 -== Time Series Chart == 52 +{{velocity}} 53 +== $services.localization.render('help.macros.chart.time') == 54 +{{/velocity}} 45 45 46 46 {{example}} 47 47 {{chart type="xy_line_and_shape" params="range:B2-C19;dataset:timetable_xy;domain_axis_type:date;domain_axis_date_format:MMM-yyyy;date_format:yyyy-MM;time_period:month;range_axis_lower:100;range_axis_upper:190" title="Time Series Chart"}}
Chart Macro displays graphical charts generated from miscellaneous data sources. Learn more
Pie Chart
Pie Chart
Example 1
Example 1
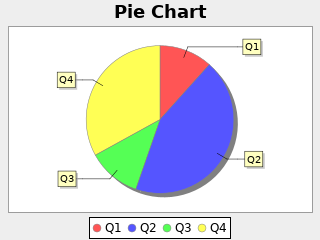
{{chart type="pie" source="inline" params="range:B2-D5;series:columns;" title="Pie Chart" width="320" height="240"}}
|=|=X|=Y|=Z
|Q1|1.2|3.4|1.3
|Q2|4.5|3.4|2.3
|Q3|1.2|4.5|9.0
|Q4|3.4|1.2|1.2
{{/chart}}
|=|=X|=Y|=Z
|Q1|1.2|3.4|1.3
|Q2|4.5|3.4|2.3
|Q3|1.2|4.5|9.0
|Q4|3.4|1.2|1.2
{{/chart}}
Example 2
Example 2
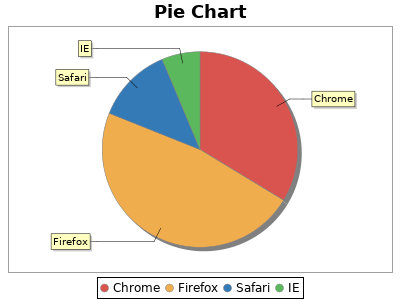
{{chart type="pie" source="inline" params="range:B2-D5;series:columns;colors:d9534f,f0ad4e,337ab7,5cb85c;backgroundColor:FFFFFF;" title="Pie Chart"}}
|=|=X|=Y|=Z
|Chrome|32|56|7
|Firefox|45|12|9
|Safari|12|45|0
|IE|6|46|2
{{/chart}}
|=|=X|=Y|=Z
|Chrome|32|56|7
|Firefox|45|12|9
|Safari|12|45|0
|IE|6|46|2
{{/chart}}
Bar Chart
Bar Chart
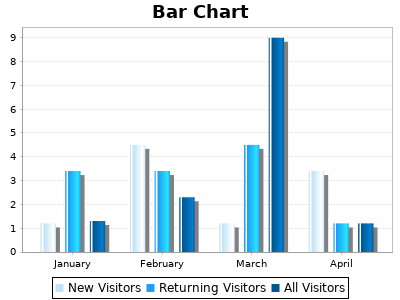
{{chart type="bar" source="inline" params="range:B2-D5;series:columns;colors:C3E3F7,1D9FF5,015891,012A45;backgroundColor:FFFFFF;" title="Bar Chart"}}
|=|=New Visitors|=Returning Visitors|=All Visitors
|January|1.2|3.4|1.3
|February|4.5|3.4|2.3
|March|1.2|4.5|9.0
|April|3.4|1.2|1.2
{{/chart}}
|=|=New Visitors|=Returning Visitors|=All Visitors
|January|1.2|3.4|1.3
|February|4.5|3.4|2.3
|March|1.2|4.5|9.0
|April|3.4|1.2|1.2
{{/chart}}
Time Series Chart
Time Series Chart
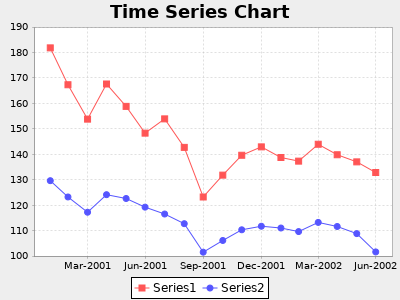
{{chart type="xy_line_and_shape" params="range:B2-C19;dataset:timetable_xy;domain_axis_type:date;domain_axis_date_format:MMM-yyyy;date_format:yyyy-MM;time_period:month;range_axis_lower:100;range_axis_upper:190" title="Time Series Chart"}}
|=|=Series1|=Series2
|2001-2|181.8|129.6
|2001-3|167.3|123.2
|2001-4|153.8|117.2
|2001-5|167.6|124.1
|2001-6|158.8|122.6
|2001-7|148.3|119.2
|2001-8|153.9|116.5
|2001-9|142.7|112.7
|2001-10|123.2|101.5
|2001-11|131.8|106.1
|2001-12|139.6|110.3
|2002-1|142.9|111.7
|2002-2|138.7|111.0
|2002-3|137.3|109.6
|2002-4|143.9|113.2
|2002-5|139.8|111.6
|2002-6|137.0|108.8
|2002-7|132.8|101.6
{{/chart}}